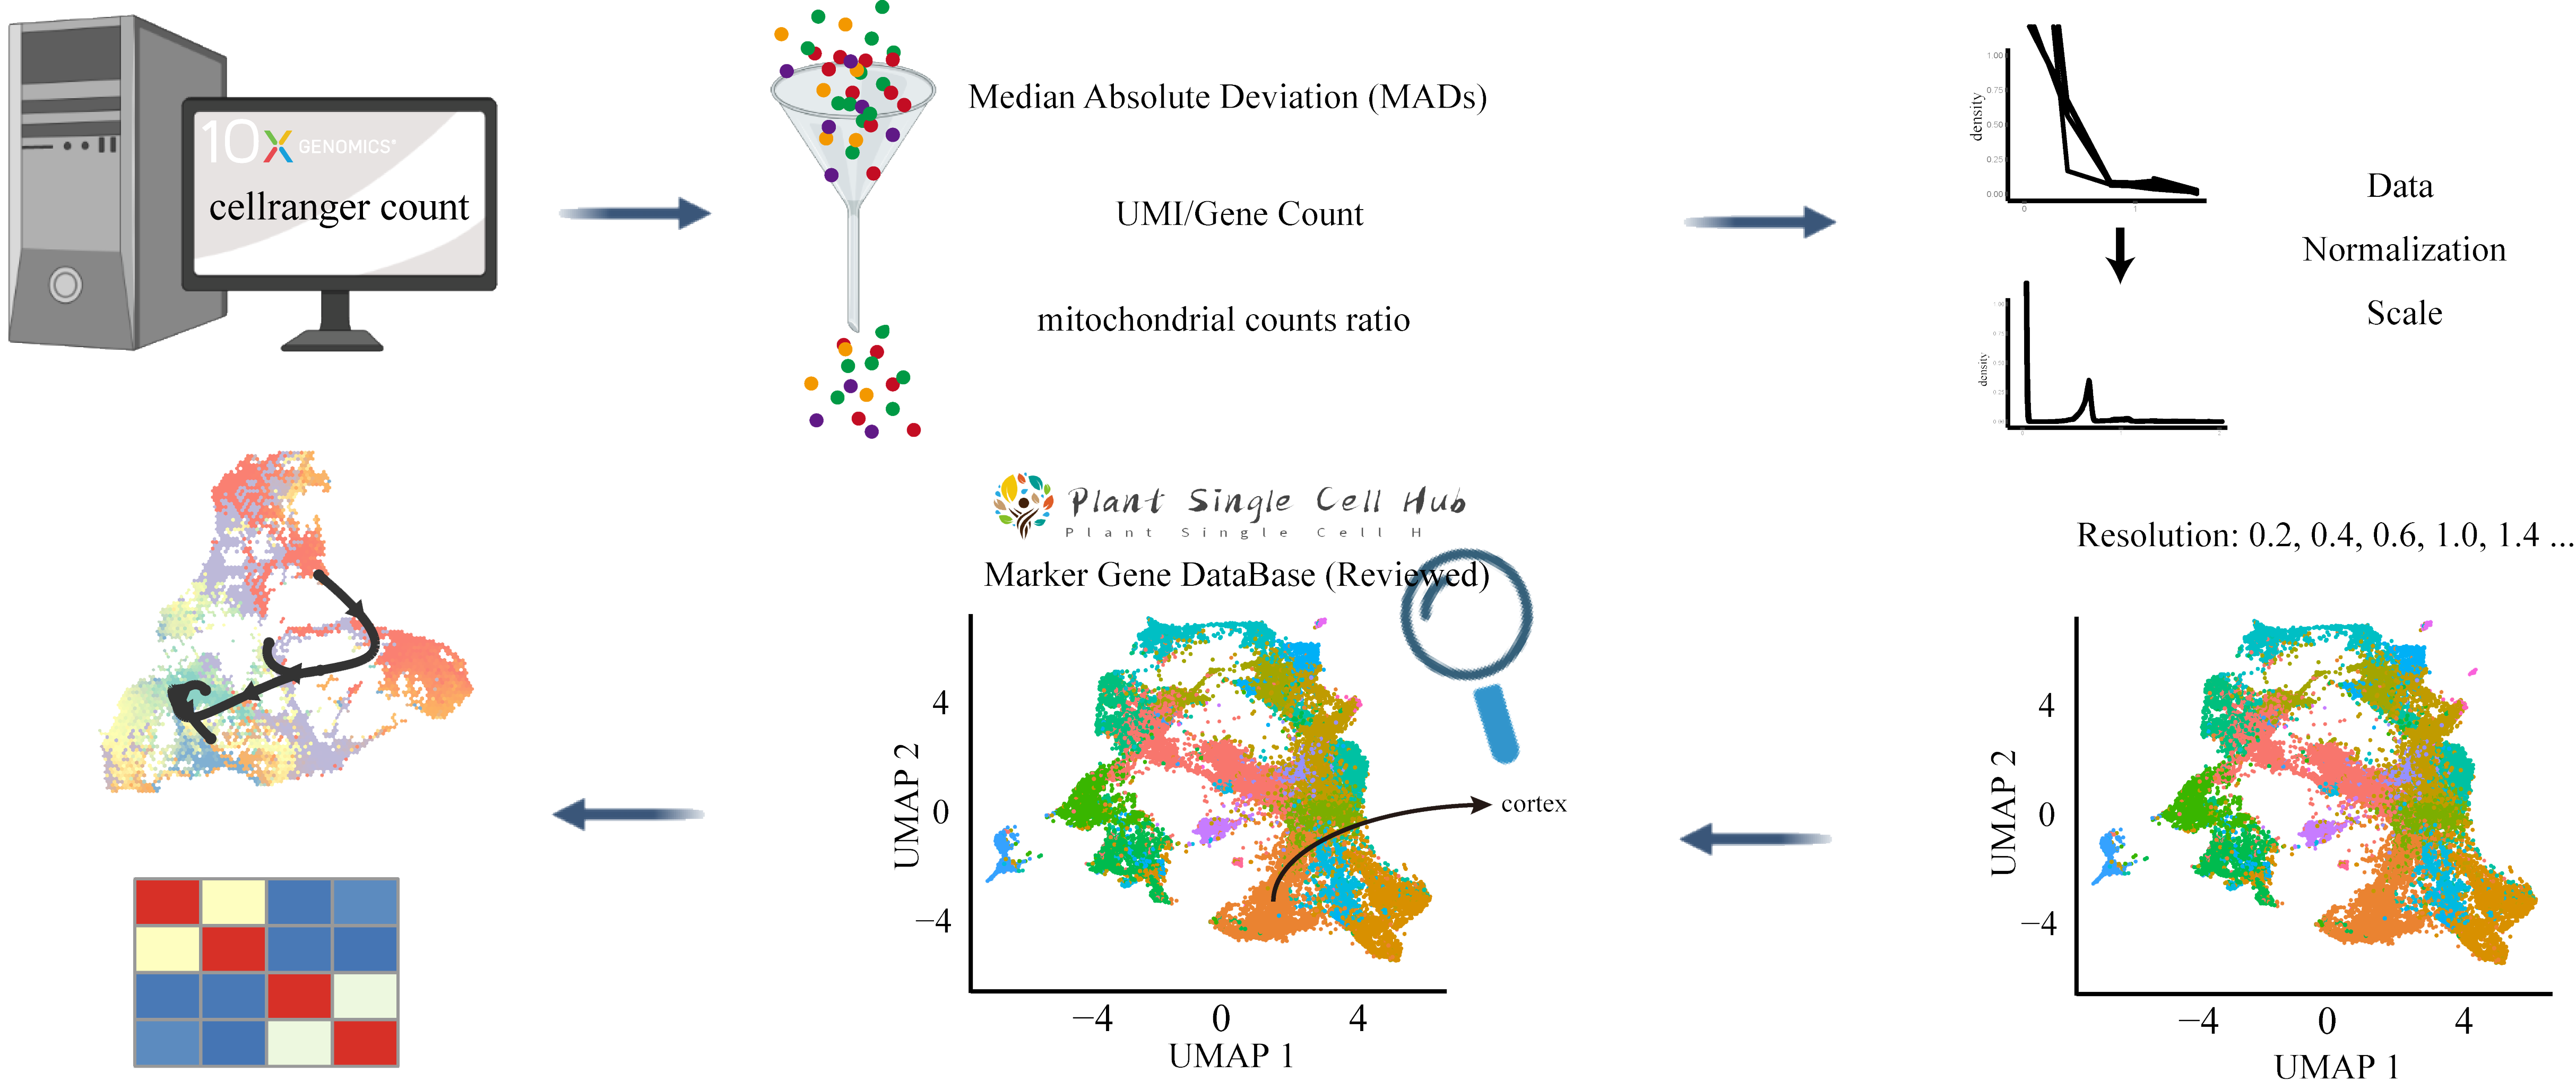
Workflow For Analysis plants scRNA Data
Customize your own workflow for the analysis of plant's scRNA by customizing Cell Ranger Count Information , Quality Control threshold , Normalization and ScaleData Method , Dimensionality Reduction Algorithm , Clustering Resolutions and Marker Genes Identification threshold .
Loading Cell Ranger count output
Output directory from
Cell Ranger count
and metadata for this scRNA-seq dataset. It's must conform to fixed file format.
Quality Control
Set follows parameters to removing low-quality cells based on the median absolute deviation ( MADs ) from the median value of each metric across all cells, number of UMIs per cell ( raw_nCount_RNA ), number of genes detected per cell ( raw_nFeature_RNA ), number of genes per UMI for each cell ( log10GenesPerUMI ), mitochondrial counts ratio ( mitoRatio ) and genes which are expressed in cells ( Gene Expressiom At Least Cell ).
Normalization and ScaleData
Read literature (Schneider et al., 2021) to assess different clustering solutions of different normalization parameters.
Clustering
The resolution is an important argument that sets the granularity of the downstream clustering and will need to be optimized for every individual experiment.
For datasets of 3,000 - 5,000 cells, the resolution set between 0.4-1.4 generally yields good clustering.
Increased resolution values lead to a greater number of clusters, which is often required for larger datasets.
Dimensionality Reduction
Selected uses PCA, tSNE and UMAP to plot of cells in each cluster.
tSNE perplexitys: how to balance attention between local and global aspects of your data. See more in How to Use t-SNE Effectively .
UMAP mindists: this controls how tightly the embedding is allowed compress points together. Larger values ensure embedded points are moreevenly distributed, while smaller values allow the algorithm to optimise more accurately with regard to local structure.
Marker Genes Identification
Identification of all markers for each cluster and annotation the cell types of the different clusters via our MarkerGeneDB (Reviewed) .
Trajectory inference
We are suggesting using Monocle and dyno package to performed this trajectory inference for whole cluster or subcluster.
Download
Celebrate! Your custom workflow is almost finished. Just click the button below to download it and used to analysis your scRNA-seq data.