How to Use Color Blind Friendly Palettes to Make Your Charts Accessible
August 1, 2023 | Figure & Color
使用场景
高水平SCI论文的发表要求所有的图均是红绿色盲人员友好的。详细解释见:Colour me better: fixing figures for colour blindness
解决办法
推荐以下方法选取正确的颜色。
网页工具
-
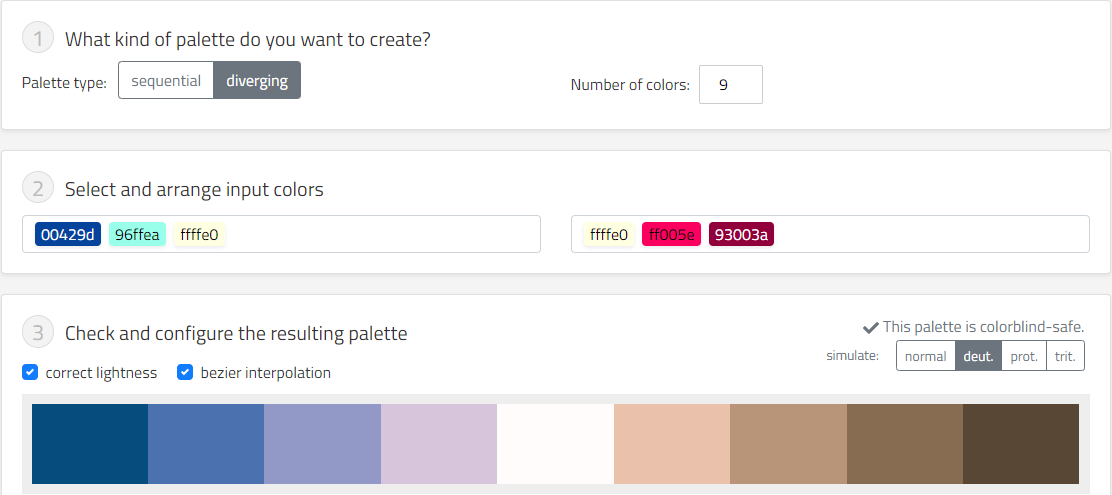
 i want hue : 可根据所需颜色数量选取需要的红绿色盲可见的颜色类型。
-
Chroma.js Color Palette Helper

R 包
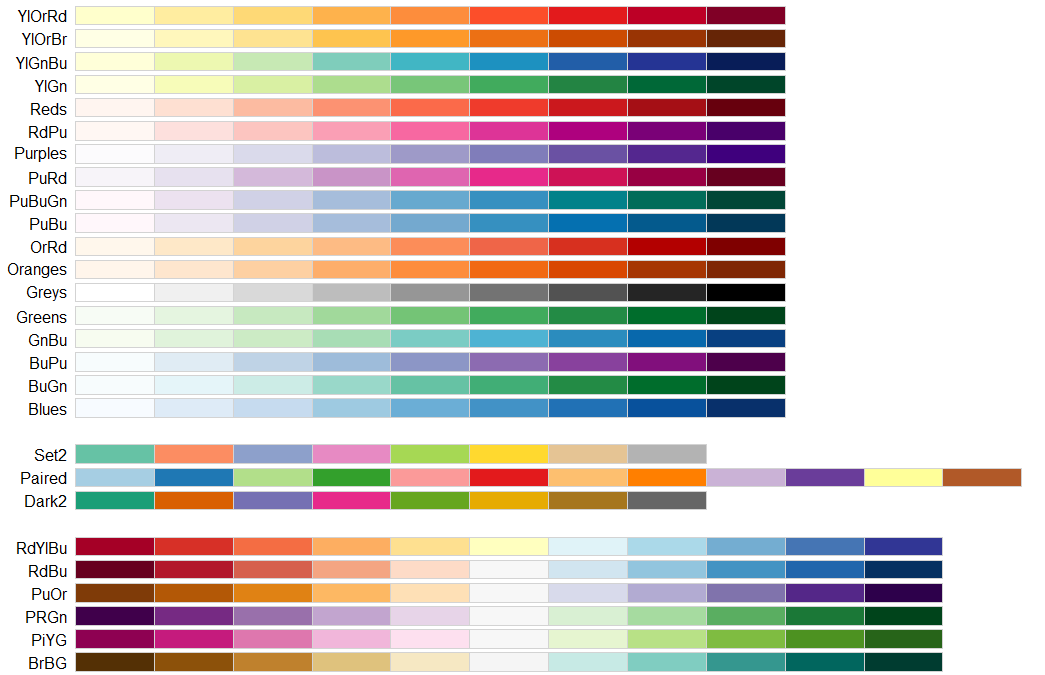
There are lots of packages already collected lots of safe colors. I list some of them, but not limited here.
library(RColorBrewer)
display.brewer.all(colorblindFriendly = T)

remotes::install_github("wilkelab/cowplot")
install.packages("colorspace", repos = "http://R-Forge.R-project.org")
library(ggplot2)
ggplot(iris, aes(Sepal.Length, fill = Species)) +
  geom_density(alpha = 0.7) + scale_fill_OkabeIto()
如何处理显微镜图片用于文章发表
August 1, 2023 | Figure
Cheat sheets for Image publishing
Images, initially drawings now photos, are widely used in biology and medicine but when published not always understandable.
Image Workflow for Novice Users
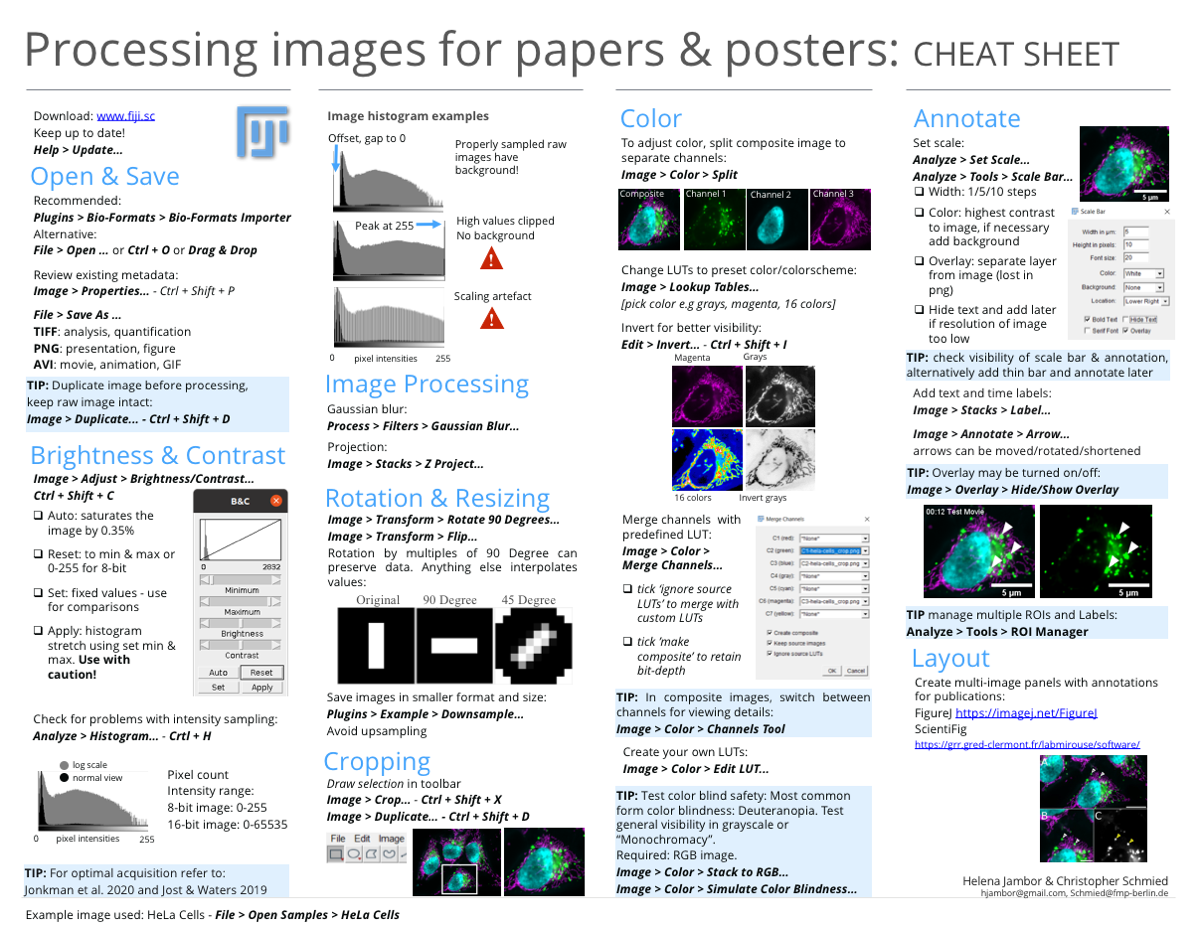
When preparing images for publication, the sequence and proper use of software matters to truthfully report observations. During the first lock down, Christopher Schmied and I therefore created cheat sheets that explain a most basic workflow to get everyone from microscope data to figure in a few simple steps.
Cheat Sheets
The workflow is summarized in two printable cheat sheets. One cheat sheet explains the steps towards a publishable image, the second cheat sheet how to implement the steps with ImageJ/FIJI image processing software.


Download
Get the cheat sheets as printable PDF, high-res pdf and psd.
Note, we used an open license, that means you can get the adaptable files and e.g., make translations, alterations, or add your own notes.
A German version was already made by Joram Schwartzmann, checkt it out!
Further resources
Beyond our starter cheat sheets more great resources help you along the way: The “Biologist’s guide to planning and performing quantitative bioimaging experiments” describes the entire arc from sample to microscope via image analysis towards data interpretation and publication. The resource lists many key points and aggregates links to more detailed descriptions, making it easy for biologists to navigate their first microscopy experiments.

More about
Microscopy image acquisition
- Seeing is believing? A beginners’ guide to practical pitfalls in image acquisition. North, A.J., 2006. J Cell Biol
- Fluorescence microscopy–avoiding the pitfalls. JBrown, C.M., 2007. Cell Sci 120, 1703–1705.
- Rigor and Reproducibility in Confocal Fluorescence Microscopy. Jonkman, J., 2020. Cytometry A
Fluorophores and Filters
- Optimizing live-cell fluorescence imaging conditions to minimize phototoxicity. Kiepas, A., Voorand, E., Mubaid, F., Siegel, P.M., Brown, C.M., 2020. J Cell Sci.
- Assessing phototoxicity in live fluorescence imaging.Laissue, P.P., Alghamdi, R.A., Tomancak, P., Reynaud, E.G., Shroff, H., 2017. Nat Methods
- Recommendations for a standardized nomenclature for probe tags used in cytometry and microscopy imagingBlenman, K.R.M., Spidlen, J., Parks, D.R., Moore, W., Treister, A., Leif, R., Bray, C., Goldberg, M., ISAC Data Standards Task Force, Brinkman, R., 2021. ISAC Probe Tag Dictionary: Standardized Nomenclature for Detection and Visualization Labels Used in Cytometry and Microscopy Imaging. Cytometry A
Sample preparation
- Seeing is believing? A beginners’ guide to practical pitfalls in image acquisition. North, A.J., 2006. J Cell Biol
Method reporting
- Towards community-driven metadata standards for light microscopy: tiered specifications extending the OME model.Hammer, M., Huisman, M., Rigano, A., Boehm, U., Chambers, J.J., Gaudreault, N., North, A.J., Pimentel, J.A., Sudar, D., Bajcsy, P., Brown, C.M., Corbett, A.D., Faklaris, O., Lacoste, J., Laude, A., Nelson, G., Nitschke, R., Farzam, F., Smith, C.S., Grunwald, D., Strambio-De-Castillia, C., 2021. Nat Methods
- A guide to accurate reporting in digital image acquisition - can anyone replicate your microscopy data?Heddleston, J.M., Aaron, J.S., Khuon, S., Chew, T.-L., 2021. J Cell Sci
- Best practices and tools for reporting reproducible fluorescence microscopy methods. Montero Llopis, P., Senft, R.A., Ross-Elliott, T.J., Stephansky, R., Keeley, D.P., Koshar, P., Marqués, G., Gao, Y.-S., Carlson, B.R., Pengo, T., Sanders, M.A., Cameron, L.A., Itano, M.S., 2021. Nat Methods
- Imaging methods are vastly underreported in biomedical research. Marques G, P.T., Sanders MA, 2020. Elife
- Micro-Meta App: an interactive tool for collecting microscopy metadata based on community specifications.Rigano, A. et al. Nat. Methods
- MethodsJ2: a software tool to capture metadata and generate comprehensive microscopy methods text. Ryan, J., Pengo, T., Rigano, A., Llopis, P.M., Itano, M.S., Cameron, L.A., Marqués, G., Strambio-De-Castillia, C., Sanders, M.A., Brown, C.M., 2021. Nat Methods
Image analysis & processing software
- Fiji: an open-source platform for biological-image analysis.Schindelin J, Arganda-Carreras I, Frise E, Kaynig V, Longair M, Pietzsch T, et al. Nature methods
- A Hitchhiker’s guide through the bio-image analysis software universe.Haase, R., Fazeli, E., Legland, D., Doube, M., Culley, S., Belevich, I., Jokitalo, E., Schorb, M., Klemm, A., Tischer, C., 2022. FEBS Lett
- Reproducible image handling and analysis. Miura K NS. EMBO J. 2021;40(3):e105889.
SCI 论文格式写作技巧
April 15, 2024 | SCI
显著性统计检验标准写法
方法部分: Statistical analysis
All data are shown as means ± standard deviation (SD) from at least three biological repeats or from three technical replicates in one of three experiments with similar results. Two-tailed Student's t test was used for comparing means between two samples (* and ** represent P < 0.05 and 0.01, respectively). One- or two-way analysis of variance (ANOVA) was used for testing the significance of the difference among different group means (different lowercase letters indicate significant differences, P < 0.05).
正文结果部分
Notably, overexpression of nalncFL7 significantly decreased FL7 transcript abundance compared with the empty vector control (Figure 4A).
正文图例部分
C and D, Relative transcript levels of FL7 and nalncFL7 in the bpl3 mutant and over-expression plants, as assayed by RT-qPCR analysis. The UBQ10 gene was used as reference transcript. Data are means ± SD of three biological replicates (n = 3; *P < 0.05, **P < 0.01, Student's t test, ns = not significant).
Data availability 写法
The RNA-seq data used in this study are found in the NCBI database under BioProject codes PRJNA292371, PRJNA376252, PRJNA378334, and PRJNA378723. The genome assembly and sequencing data for barley accession Baronesse chromosome 1H generated in this study have been deposited in the NCBI database under BioProject code PRJNA879438. RenSeq-PacBio of Baronesse raw, circular consensus sequences, and de novo assembly have been deposited in the NCBI database under BioProject code PRJNA422986. Genomic sequencing data and assembly for M. oryzae isolate KEN54-20 and avr-rmo1 have been deposited in the NCBI database under BioProject code PRJNA881958. The sequences of plasmids used for plant transformation in this study have been deposited in the NCBI database with accession codes OP561810 (Mla3), OP561809 (Mla3Δ6), and OP561811 (RGH2/RGH3). All data needed to evaluate the conclusions in the paper are present in the paper and/or the Supplemental data. Raw genotypic, phenotypic, and source data for figures and supplemental figures have been deposited on figshare (https://doi.org/10.6084/m9.figshare.21365532.v2). A material transfer agreement with The Sainsbury Laboratory is required to receive the materials. The use of the materials will be limited to noncommercial research uses only.
图片细节
-
图片最小字体为6磅;
-
字体为Arial or Helvetica;
-
选取对红绿色盲友好的颜色配色;